

- Today/Yesterday: “22.01.2022”, “23.01.2022”, “24.01.2022”
- Based on survey periods or custom filter: “22.01. - 05.03.”, “08.03. - 15.03.”
- This month/ Last month: “September”, “October”, “November”
- This Quarter/ Last quarter: “Q1”, ”Q2”, ”Q3”
- This Year/ Last year: “2022”, “2023”, “2024”
Data collected from NPS questions will be split, showing you exactly how many promoters, passives and detractors you had.
Creating the chart:
First add a new chart by clicking the ”+” in the top right corner of your dashboard: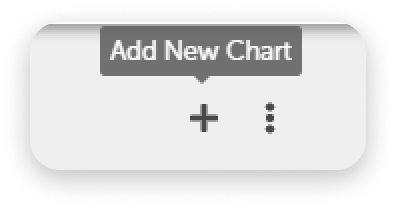
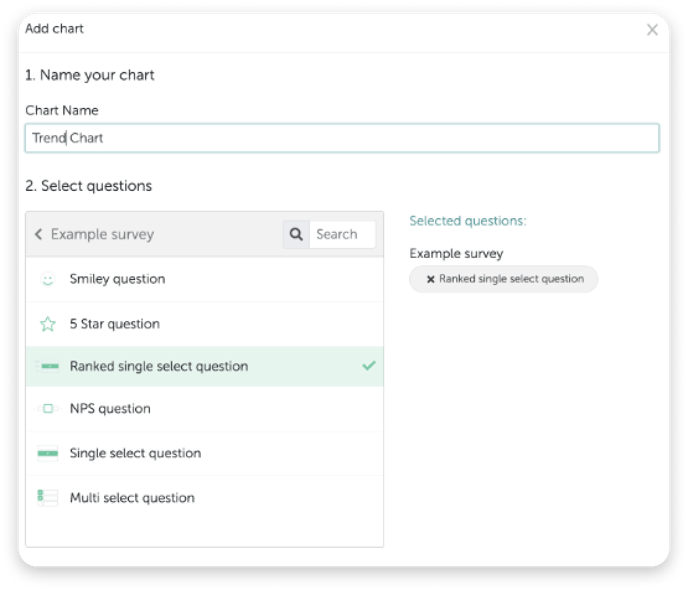
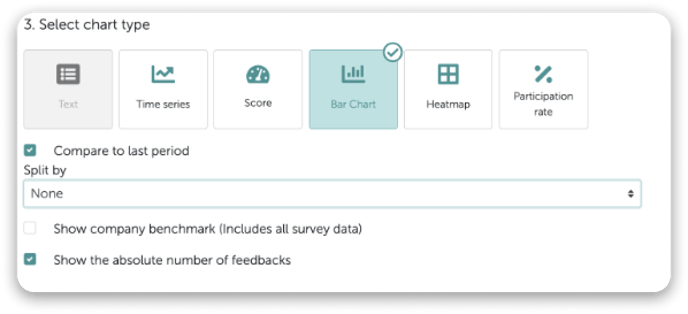
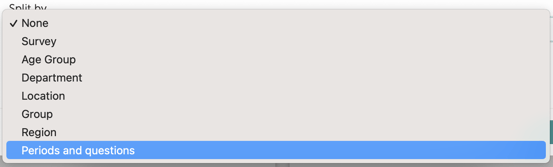
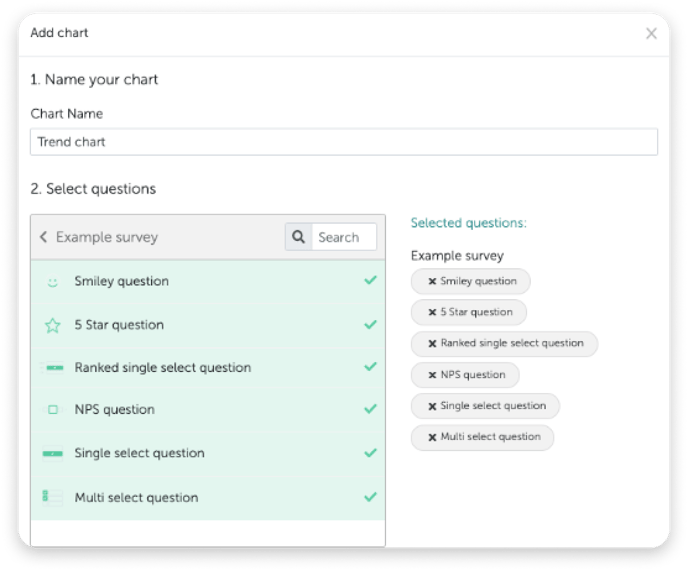
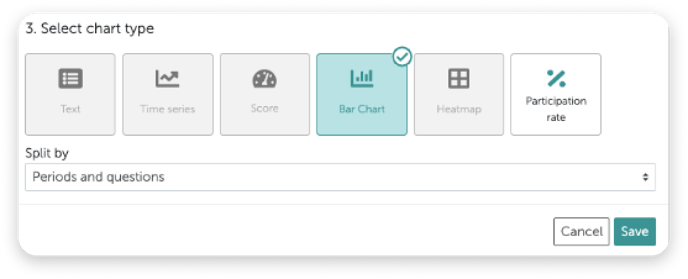
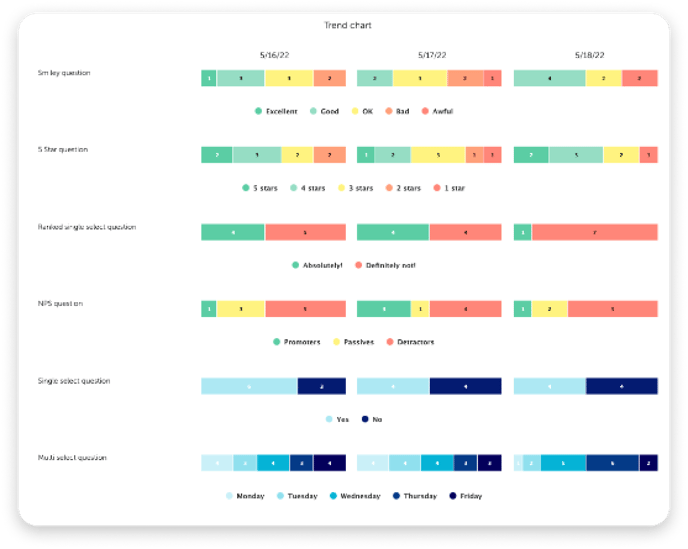
- Trend charts are always created using the full width of the screen, but can be edited later. You can also choose whether you would prefer to see the full height of the chart or scroll within the chart.
- These charts cannot be exported into Powerpoint or Excel.
Related articles
- What is the Topic Trend Chart?
- What is a dashboard and how do I create a new one?
- How can I compare the results of different employee groups in my dashboard?
- Time zone visibility in dashboard periods: Why periods differ by user location
- How Can I Create Comparable Surveys with the Honestly Engagement Survey™ or the Honestly Pulse Survey™?