

With the “Result display” function (in the settings), you can alternatively display average values (means) in any response scales you want, so you no longer have to convert them in Excel.
When is this helpful?
This feature is particularly useful if you…- evaluate your performance reviews or goal achievement using school grades (example: 1–6)
- use country-specific scales (e.g. 1 = very good vs. 1 = very poor)
- want to use reports directly from Honestly without workaround conversions.
What exactly is changed?
You can define how averages are calculated and displayed. There are two levels:- Account default: in Settings > Results Evaluation, which then applies to the entire account
- Dashboard-specific setting: can override the account default for individual dashboards
What options are available?
You can choose between:- Standard percentage scale (0–100%)
- Custom scale: display in the original or desired scale of the surveys (e.g. 1–5 or 1–7)
- Worst value (e.g. 1)
- Best value (e.g. 5)
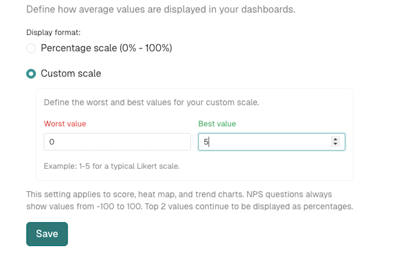
Where do I set this up?
A) At account level (account default)
In the account “Settings” there is a new “Results Evaluation” tab. There you define the default (calculation method + display format).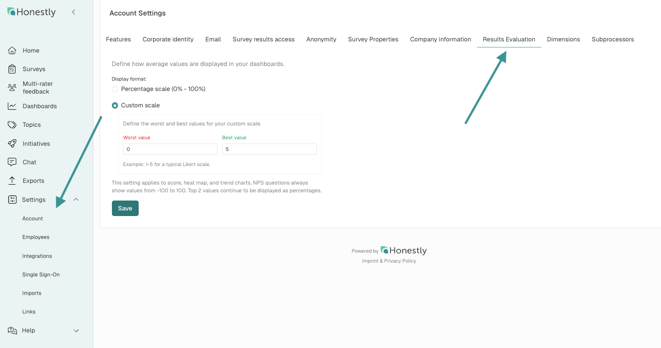
B) Per dashboard (overrides the account default)
When creating or editing a dashboard, you’ll find the “Dashboard settings” section under the three‑dot menu in the top right corner of the dashboard.
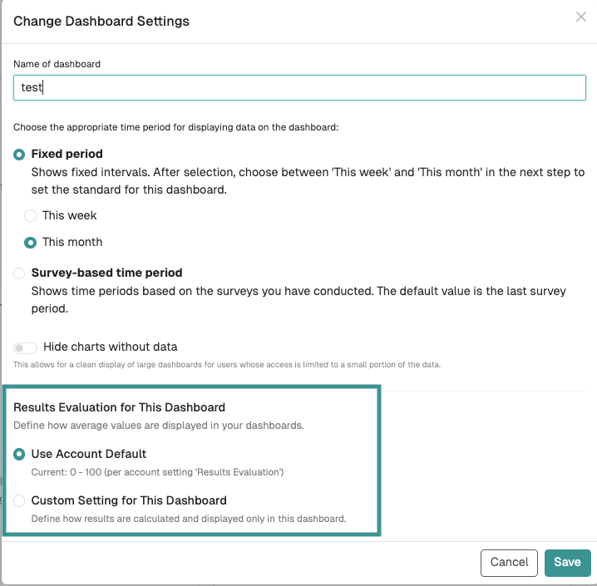
There you can choose:
- “Use account default”
- “Custom settings for this dashboard”
How can I see in the dashboard what is currently active?
In the dashboard, a settings note is displayed under the title at the top right in the menu, for example:
FAQs
-
Are my data recalculated or only displayed differently?
The setting controls the display or scaling of the visualization. The goal is that you no longer need any manual conversion. -
Can I use a different logic per dashboard than in the account?
Yes. The account default is the basis, but each dashboard can override it.