What is a heatmap?
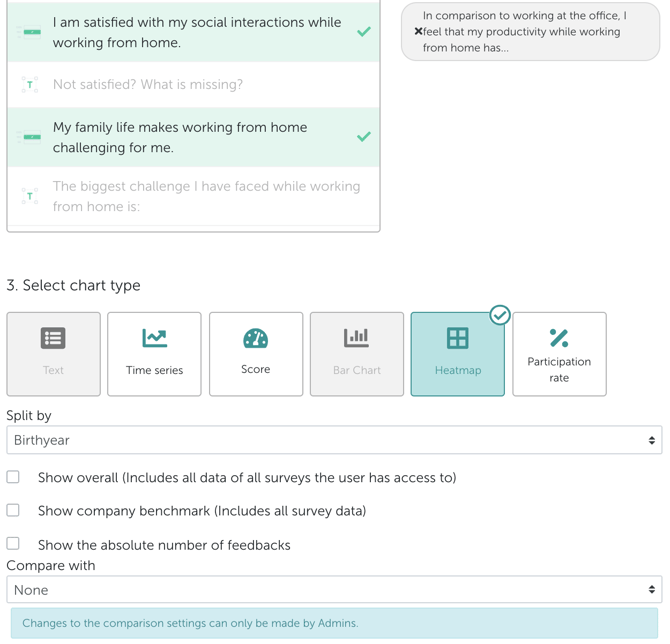
A heatmap is a chart in which you can graphically compare the results of several questions, broken down by attributes (e.g. employee groups, departments, etc.). Intuitive color coding ensures the legibility of the heatmap. How the values and colors come about is explained in How are scores and heatmap colors calculated?.