How exactly is the result calculated? For this example, we have chosen a Likert scale with 5 items. The answer options are worth 0-4 points in descending order (“very good” = 100%; “very poor” = 0%).
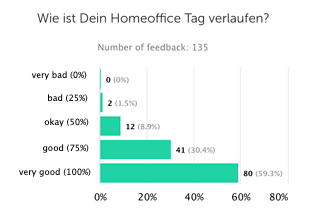
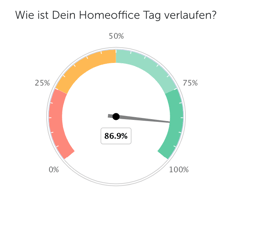
How exactly is the result calculated?For this example, we have chosen a Likert scale with 5 items.The answer options are worth 0-4 points in descending order (“very good” = 100%; “very poor” = 0%).The average (mean) of all answers is calculated. To do this, the frequency and score of the given answer are multiplied by each other, divided by the total number of answers, and then converted into a percentage value, where a value of 100% represents the maximum achievable result.For this example, the result is calculated as follows:135 feedbacks were collected:#feedback = 135Thereof:80 times “very good” = 80*100% = 800041 times “good” = 41*75% = 307512 times “okay” = 12*50% = 6002 times “bad” = 2*25% = 500 times “very bad” = 0*0% = 0This results in a total score of:8000 + 3075 + 600 + 50 + 0 = 11725The maximum total score achievable with 135 feedbacks:135 * 100 = 13500The final result is calculated as follows:11725 /13500 ≈ 0,8690,869* 100 = 86,9%Accordingly, the rounded result displayed in the gauge chart is: 86.9%