
When creating the chart, feel free to select a mixture of different question types. These will be displayed according to the amount of answer options that each contains, but also in the order in which they appear in the survey.
The results of the selected period filter and the 2 periods previous to this will be displayed. For example, if you are currently viewing May's data, both March and April's data will also be shown:
- Today/Yesterday: “22.01.2022”, “23.01.2022”, “24.01.2022”
- Based on survey periods or custom filter: “22.01. - 05.03.”, “08.03. - 15.03.”
- This month/ Last month: “September”, “October”, “November”
- This Quarter/ Last quarter: “Q1”, ”Q2”, ”Q3”
- This Year/ Last year: “2022”, “2023”, “2024”
Please note:
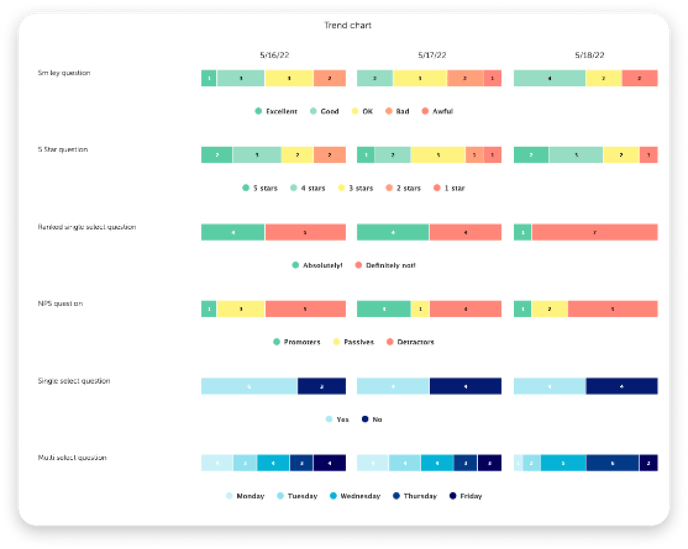
Data collected from NPS questions will be split, showing you exactly how many promoters, passives and detractors you had.
Creating the chart:
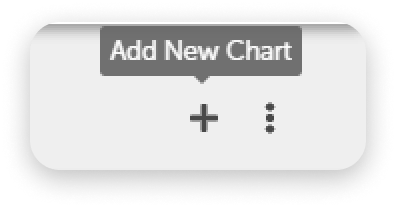
First add a new chart by clicking the "+" in the top right corner of your dashboard:
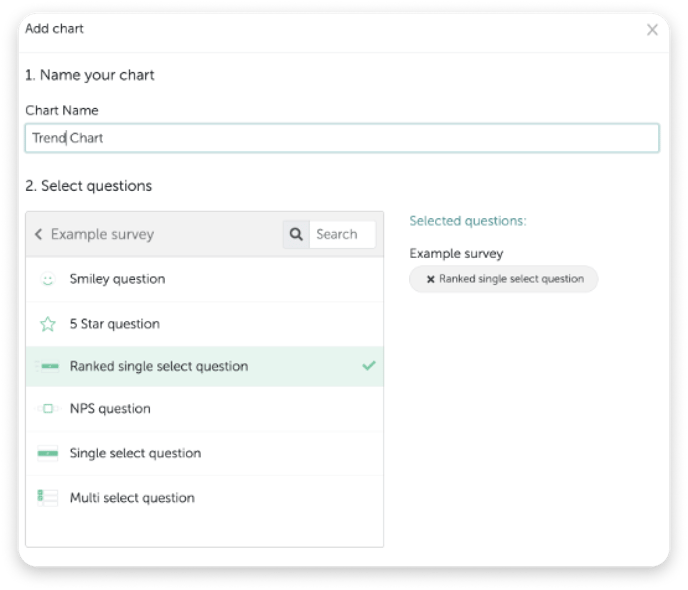
Then select which questions you would like to have displayed in the trend chart. The following steps will look different if you have selected either just one or multiple questions.
One question only
First, select which question you would like to have displayed:
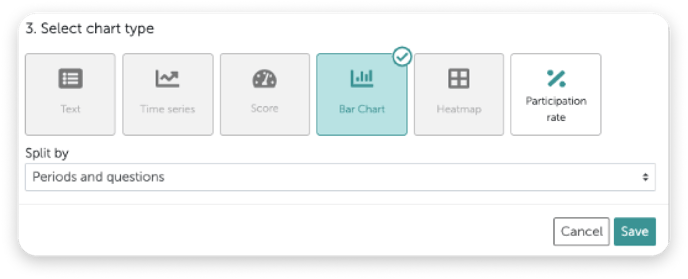
Next, select the "Bar chart" option:
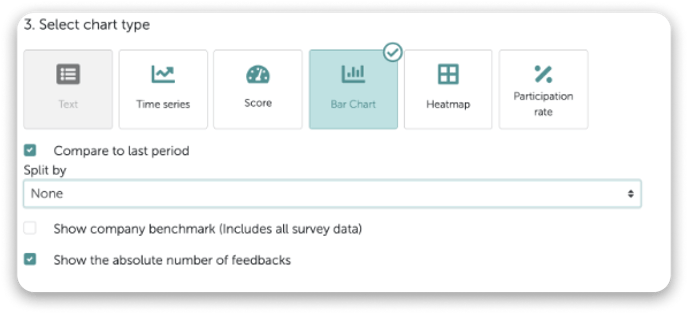
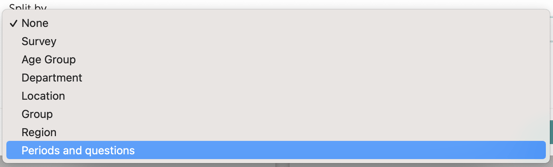
And in the "Split by" drop down list, select the last option - "Periods and questions":
Various questions and types
First, select which questions you would like to have displayed: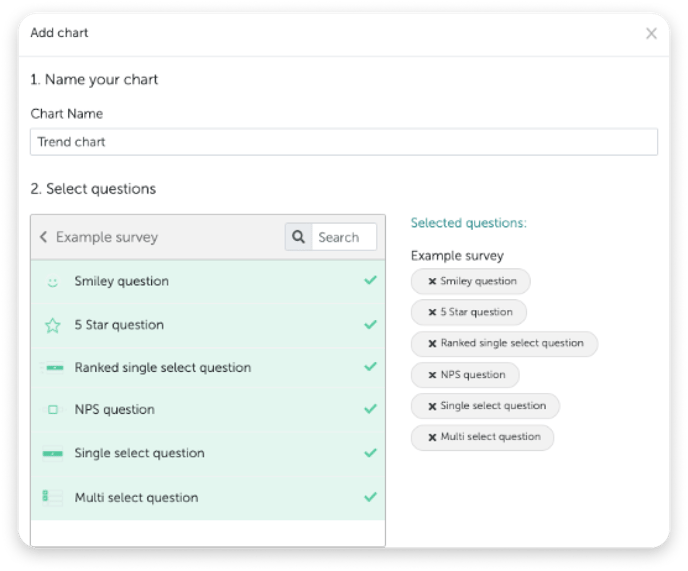
Next, select "Bar chart" and you will see that "Periods and questions" has automatically been selected as the "Split by" option:
The trend chart will then look something like this:
Please note:
- Trend charts are always created using the full width of the screen, but can be edited later. You can also choose whether you would prefer to see the full height of the chart or scroll within the chart.
- These charts cannot be exported into Powerpoint or Excel.