The Net Promoter Score is used in Market Research and is the factor used to show a company’s success.

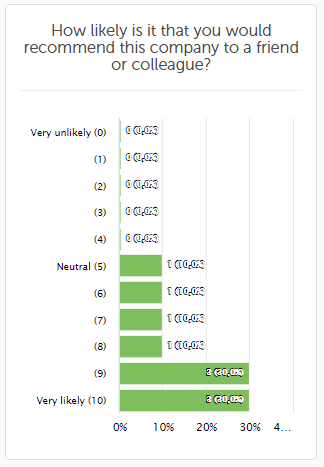
The question which is almost always used to gain this data is, “How likely is it that you would recommend this company/product/service to a friend or colleague?” The ends of the scale are labelled with “Very likely” and “Very unlikely” and the answers are given on the scale from 0 and 10. It is therefore not possible to change this wording and it will appear automatically if you choose to use an NPS question.
NPS questions are calculated by finding the difference between the “promoters” (enthusiasts) and the “detractors” (critics). Those who give a rating of 9 or 10 are considered promoters and those who give a rating of 0 to 6 are considered detractors. Those who give a rating of 7 or 8 and considered “passives”.
The Net Promoter Score is calculated as follows:
NPS = promoters (%) – detractors (%)
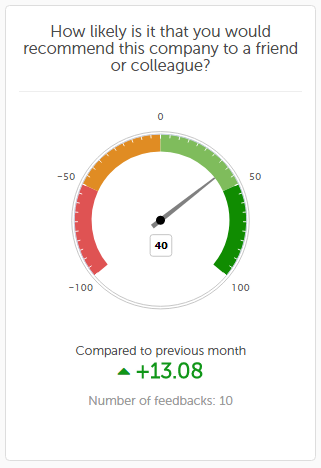
The NPS can therefore lie anywhere between -100 and 100.
NPS in the Analysis section:
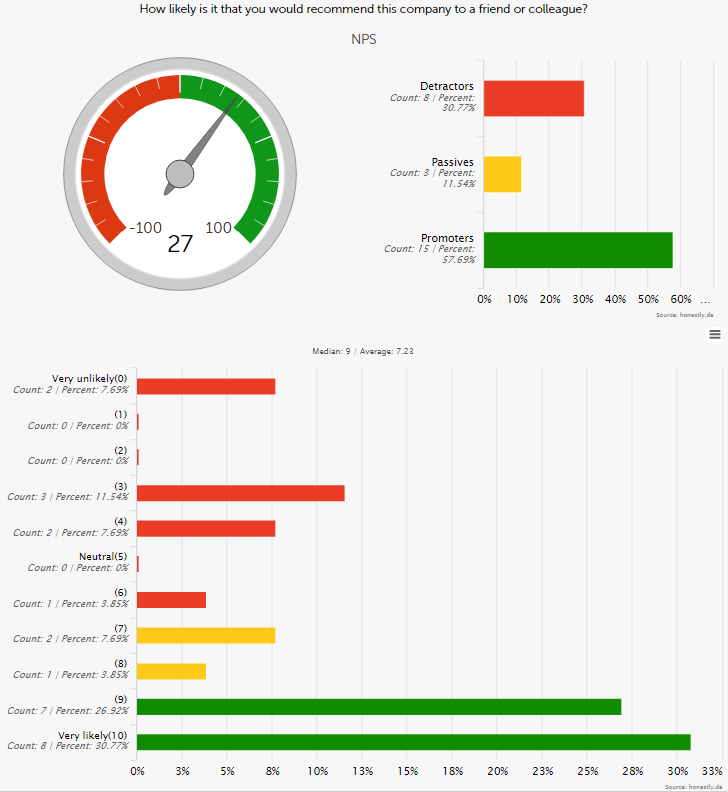
In the Analysis section, NPS results are shown as a gauge. In addition, using traffic light colours, it is easy to see the amount of enthusiasts/critics the company has.
NPS in the Overview section:
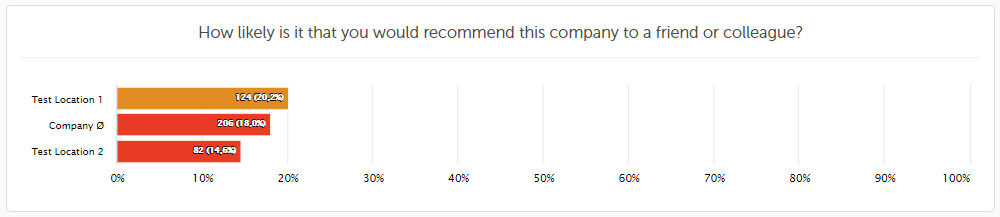
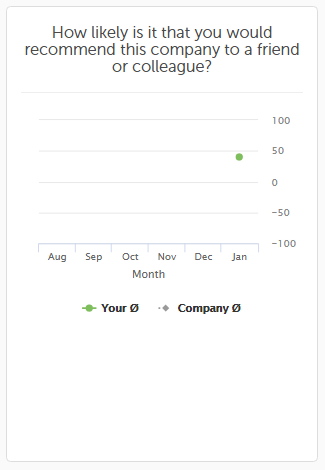
You can choose to display the NPS results in various ways on your dashboard.
- In a comparison (also compared to the whole company; benchmark):
2. As a benchmark line chart:
3. As a gauge:
4. As a bar chart: