In the dashboard you have the possibility to display smiley questions with a barometer or a line diagram.The results showed in these graphics can now be calculated in 2 different ways - using the Top2 method or as an average.

Top2 method
The top 2 box score (sometimes called T2B) is a very common way of reporting and analyzing scale questions, especially when using a 5-point Likert Scale. As its name implies, the T2B score is the sum of percentages for the top two most favorable points on a scale divided by the total number of responses. This generates a top2-box proportion that allows to assess the ratio of the most favorable ratings.
The T2B score makes comparisons quick and easy. It simplifies the analysis: instead of analyzing multiple numbers, you only need to check one. Regardless of whether you compare results across brands or stimuli (e.g. when testing concepts), the results in the T2B allow you to compare results side by side more efficiently.
Average:
Alternatively, you can display your results as a normal average value. As usual, all values are added together and divided by the absolute number of answers given.
How to configure it in your account:
To display results in one of these two display modes, you must first navigate to the respective dashboard. To add a new graph to the dashboard, press the "+" in the upper right corner.

Name your new graphic and select the question whose results you would like to display. Please note that only smiley questions allow you to choose between Top2 or average calculation.
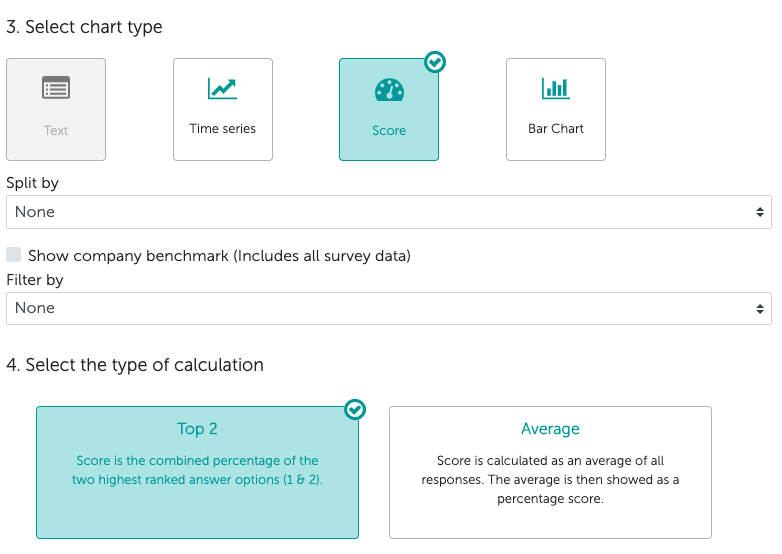
In the third step, select the graph type you want to use and in the fourth decide whether you want to calculate the results using the Top2 approach or the average value.