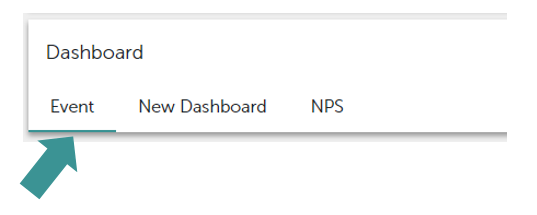
Go to the "Dashboards" section.
Select the dashboard which you would like to edit. It will be highlighted:
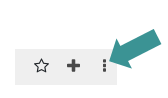
To edit the dashboard, click here:
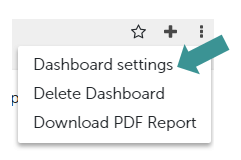
To rename a dashboard, select "Dashboard settings":
and edit the name here:
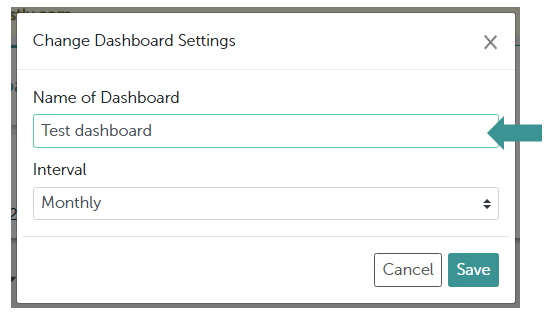
To choose either a monthly or weekly dashboard, select "Dashboard settings" again and select monthly/weekly from the drop-down list:
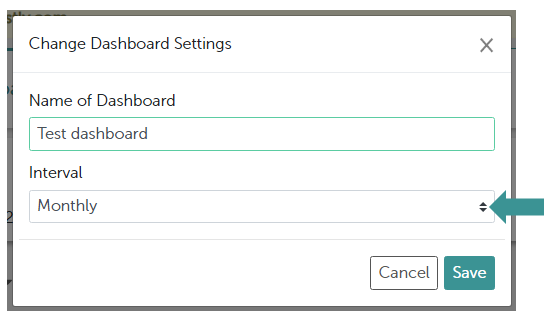
Remember to save your changes!
To delete individual charts:
Position your mouse over the diagram and this delete symbol will appear. Click this and the individual chart will be deleted.

To add a chart:
Click on "+" to add a chart:

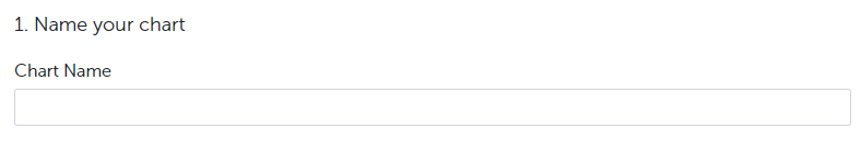
There are 3 steps to adding a chart:
- Give the chart a name:
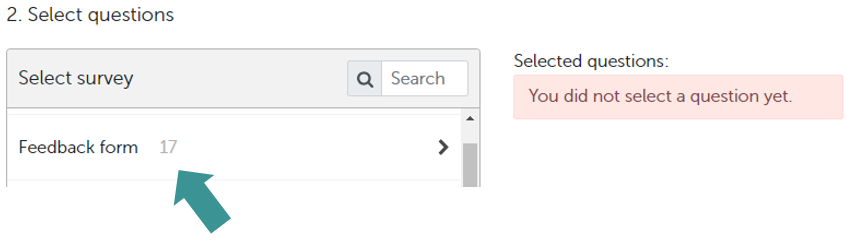
2. Select which survey to use as its information source. The system will immediately show you how many questions it contains:
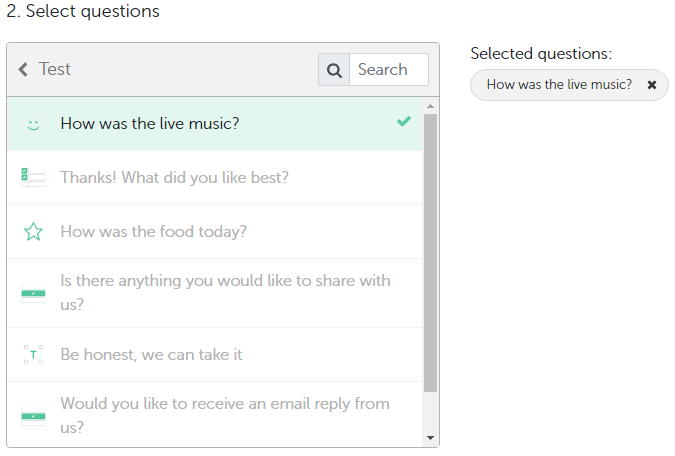
Click on the survey you would like to use and select the question. The icon on the left of each question shows what type of question each of them is:
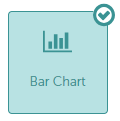
3. Select which type of chart to use out of those highlighted:
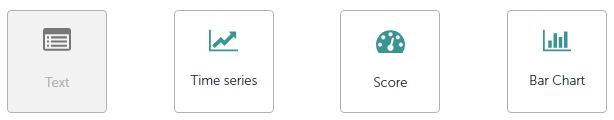
For example a bar chart:
And remember to save all your changes!
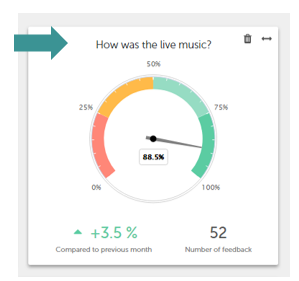
The new chart will be added to the bottom of your dashboard.
To move your chart, simply click on its title and drag and drop it into the desired position.
If you would like to change the size of your chart, click on this symbol in the top right hand corner of your chart:
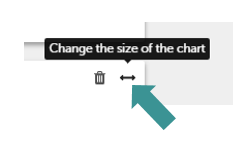
Choose which size you would like from the drop-down list:
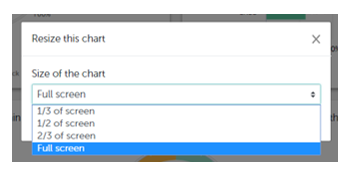
And save your changes.
To learn more about creating new dashboards, click here.
Or if you would like to find out how to receive the results as a PDF report, click here.