
In order for the response rate to be added to your dashboard, you must create a new chart on the respective dashboard.
Create a "New chart" in the selected dashboard and choose just 1 question from the survey. Then select "Participation Rate" as the chart type and save your changes. The participation rate of that whole survey will be displayed.
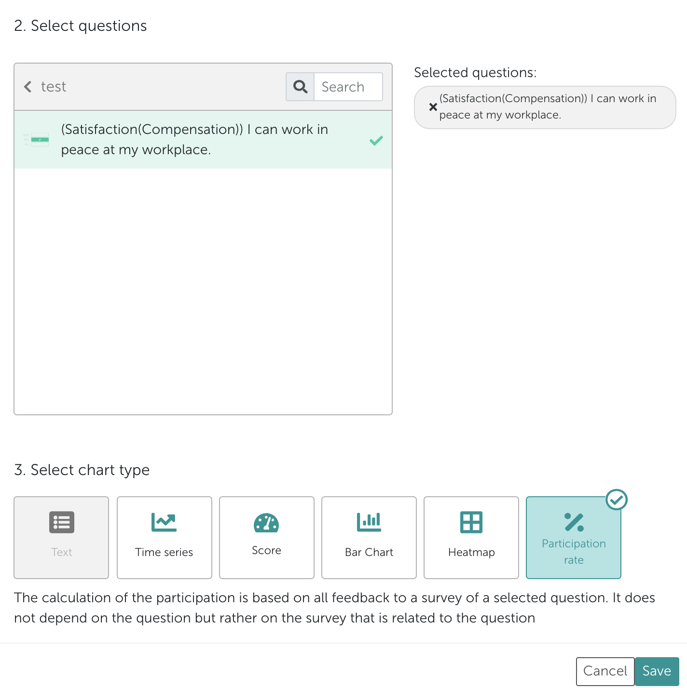
Please note:
The response rate always refers to the whole survey and not to the single question item which has been selected.
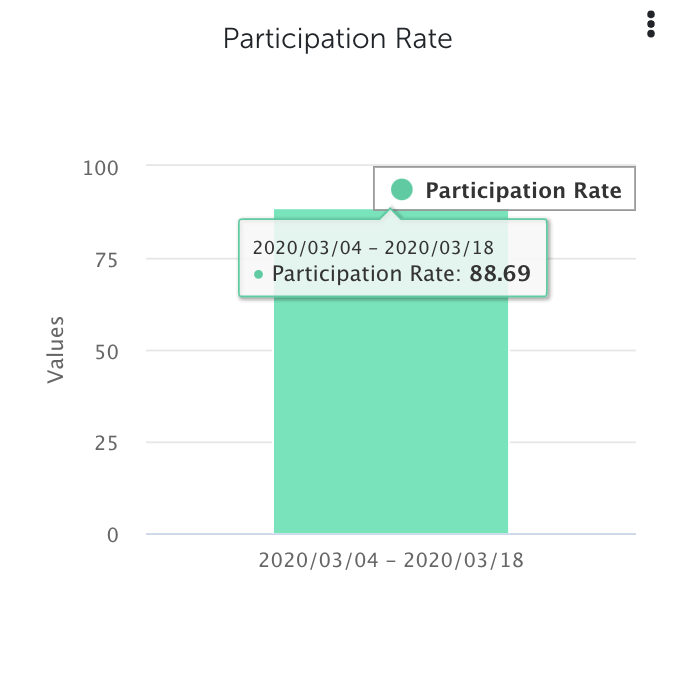
Next, the new chart appears on the dashboard. We recommend naming the chart accordingly, e.g. "Participation Rate".
Please note:
If you have a survey where "multiple responses are allowed" and each of your employees can participate more than once, the response rate chart will still show which percentage of the invited employees participated.
In contrast, other charts will show how many responses you received in total. For example, if 20 employees were invited and each participated twice, "60 responses" will be shown in most graphs, but "100%" will be seen in the response rate chart.