
It is possible to compare the results of several surveys (or stores/events, depending on what the section is called in your specific case) in the dashboard.
In addition, if you have created categories such as regions in your surveys, these can also be compared.
Read how to create categories here.
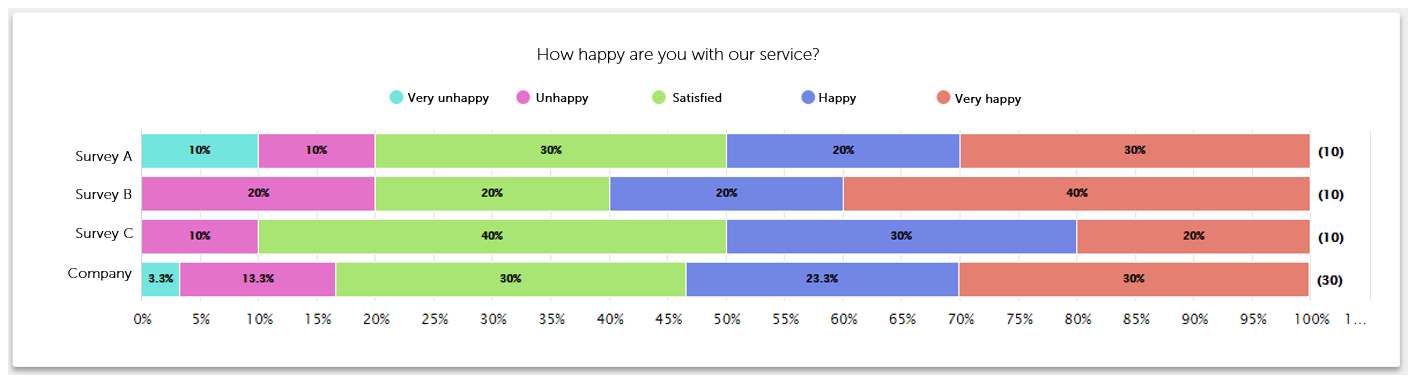
All results can also be compared to the company's benchmark as shown below.
PLEASE NOTE: Only surveys (stores, events etc) using the same feedback form (questionnaire) can be compared.
Displaying data from Smiley questions:
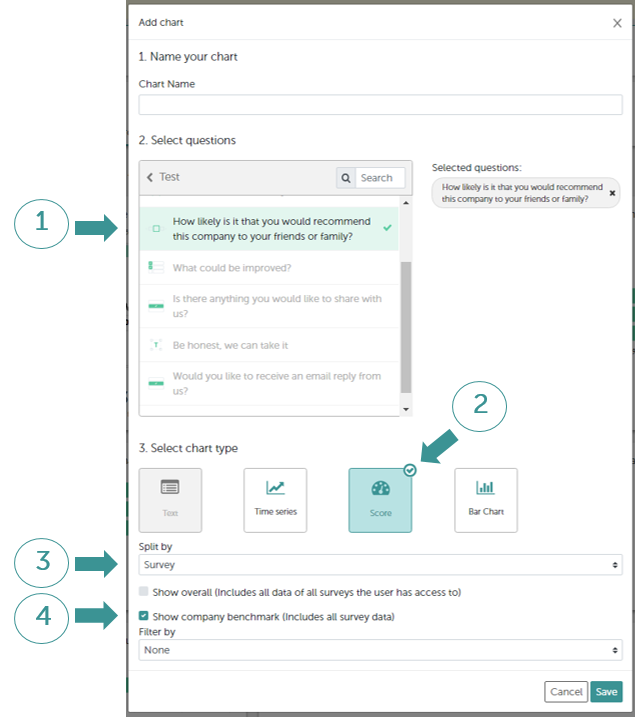
To create this kind of chart, just follow these steps when creating a new chart on your dashboard:

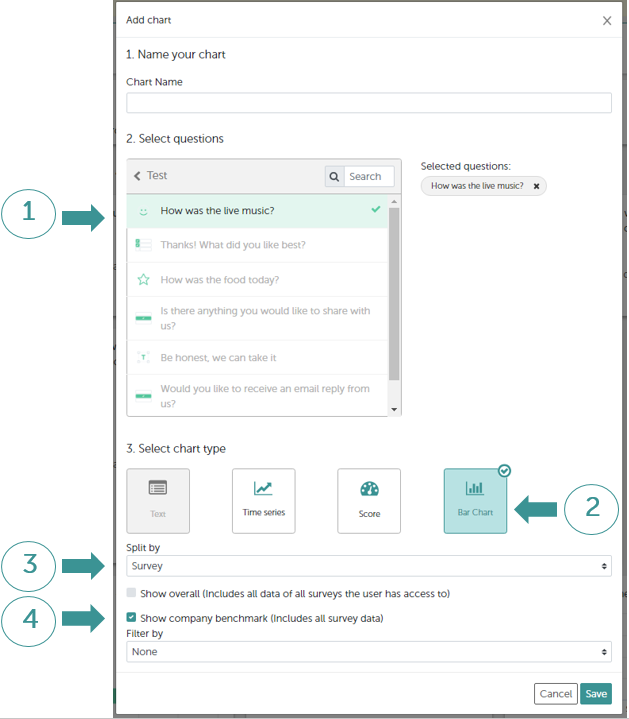
Then click "Save".
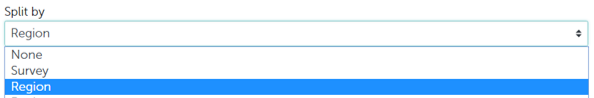
If you would prefer to split the chart by categories instead of surveys, as shown above, just select this from the drop-down list.
If a user has access to more than one survey (stores, events etc), ticking the "Show overall" box will allow them to see the total of all those surveys as well as the comparison to the company's benchmark:
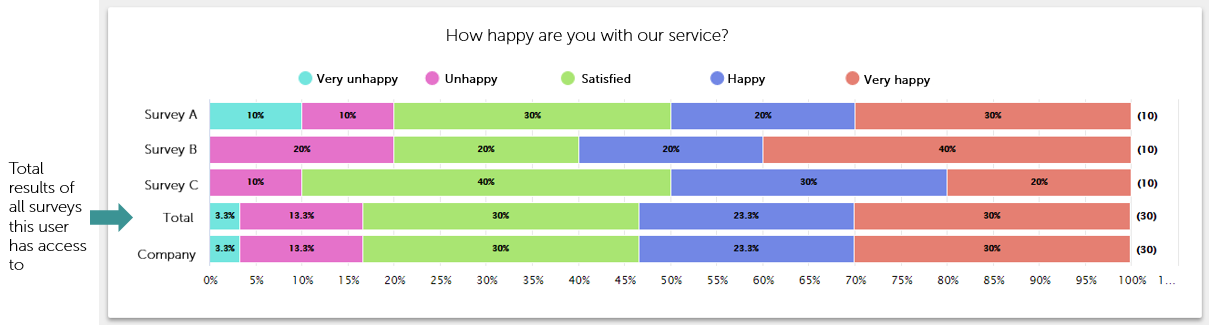
Administrators will of course have 2 identical lines for the total and company benchmark as they have access to all surveys.
Displaying data from "Single/Multiple selection" questions:
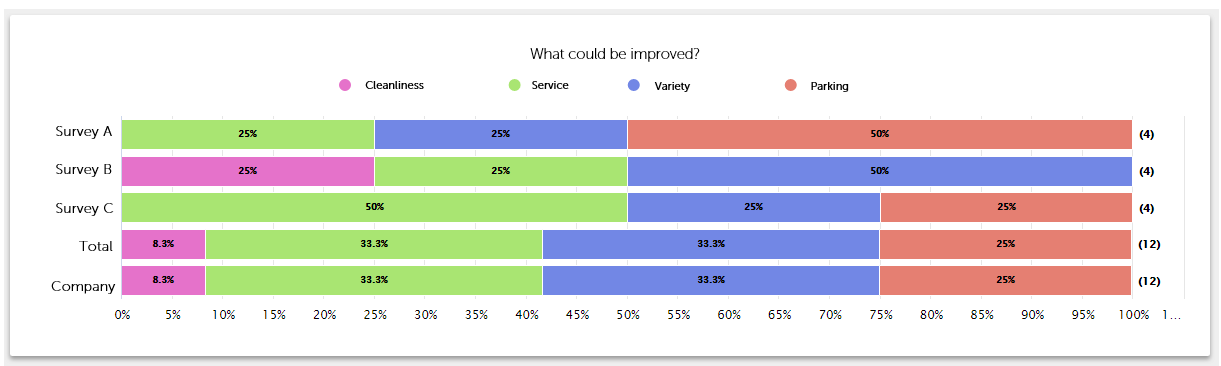
To create this kind of chart, just follow these steps when creating a new chart on your dashboard:

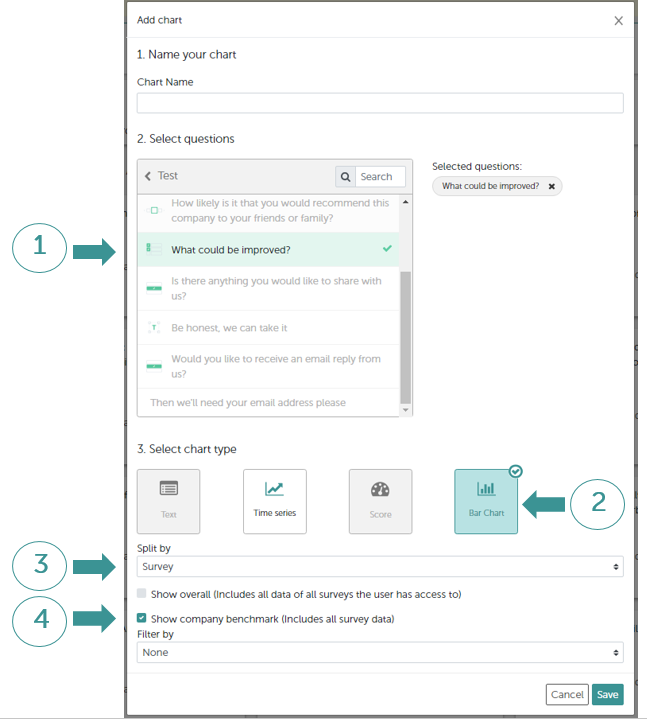
Then click "Save".
Again, if you would prefer to split the chart by categories instead of surveys, as shown above, just select this from the drop-down list (3).
And just as before, ticking the "Show overall" box will display the "Total" results of all surveys the user has access to.
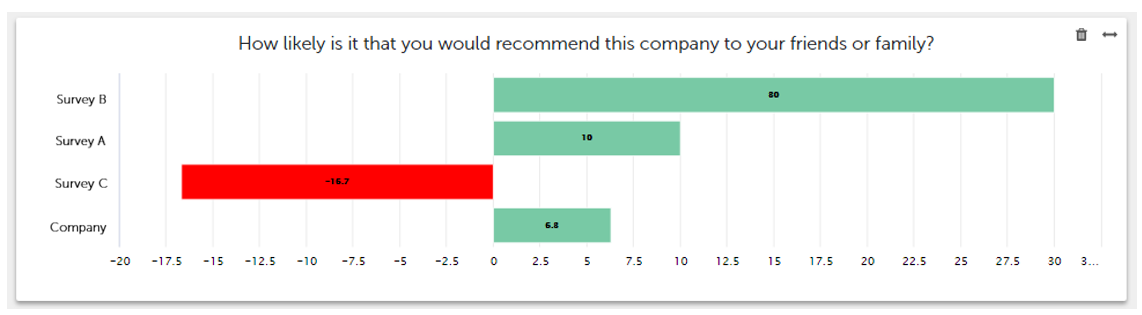
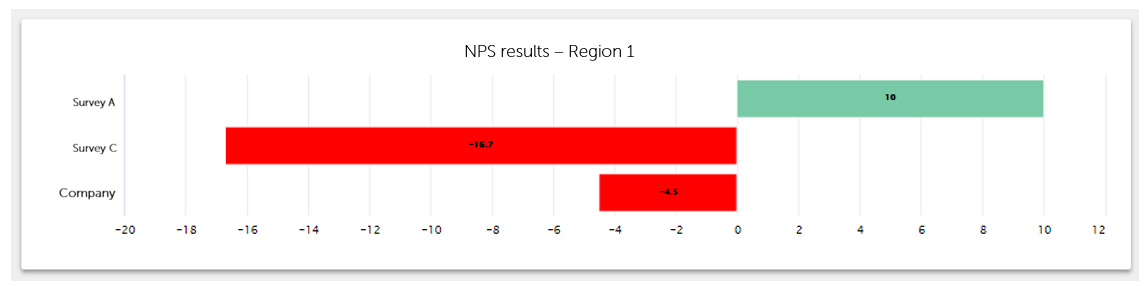
Displaying data from NPS questions:
Here you can see the comparison of all your surveys' NPS results:
To create this kind of chart, just follow these steps when creating a new chart on your dashboard:
Then click "Save".
Again, if you would prefer to split the chart by categories instead of surveys, as shown above, just select this from the drop-down list (3).
And just as before, ticking the "Show overall" box will display the "Total" results of all surveys the user has access to.
To compare the NPS results of the surveys in just one category (in this case, Region 1)
like this:
just follow these steps:

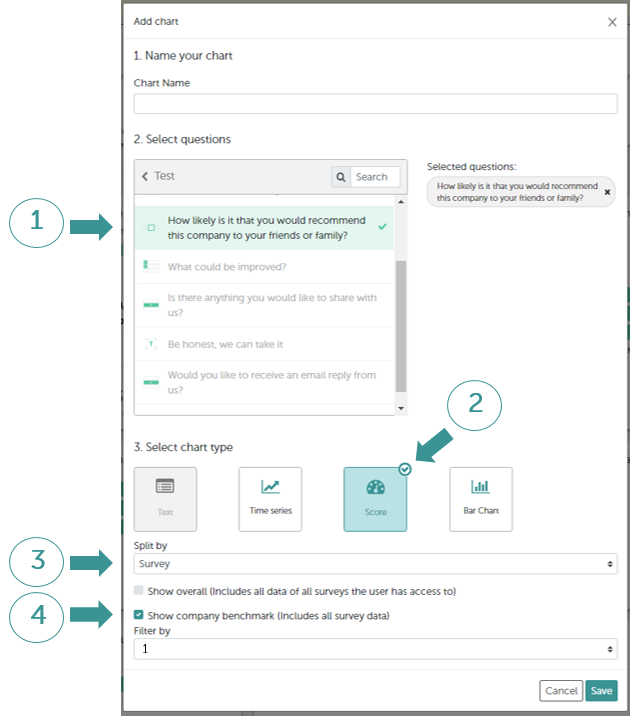
Then click "Save".
Feel free to contact us if you have any questions about displaying your data. We're always happy to help!
E-Mail: service@honestly.com
Tel.: +49 221 643 078 980
These articles might be interesting too: