> ## Documentation Index
> Fetch the complete documentation index at: https://help.honestly.com/llms.txt
> Use this file to discover all available pages before exploring further.
# How can I export data/charts from the dashboard?
> Please note that the dashboards should be fully loaded before you press the export button.
An Honestly dashboard can be exported in 3 different formats:
\*\* Please note that the dashboards should be fully loaded before you press the export button.
To export the dashboard, click on the three dot menu on the right and select the type of export you'd prefer.\\
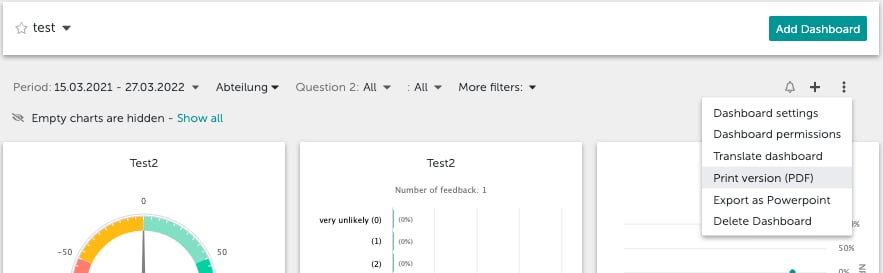 **1. Print version (PDF-Export)**
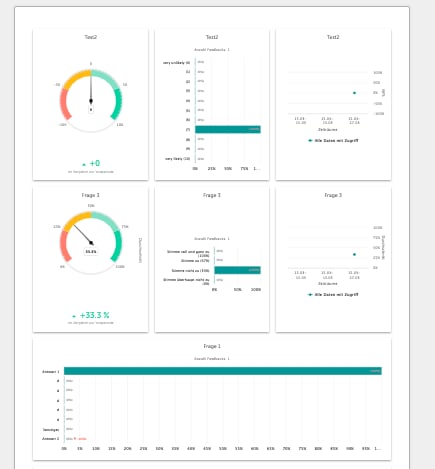 \*\* Filter, survey period and the information of the user who created the export are not included on the first page.
To keep using or print the PDF, just right-click on it.
**2. PowerPoint export**
This export creates one chart per slide.
Filter, survey period and the information of the user who created the export are also included.
1. In our PowerPoint export, no open text fields are displayed.
2. Advanced survey filters are not displayed either.
3. The company logo is also not displayed.
**3. Excel Export** (individual charts)
The Excel export can be found under the 3 dots in the respective chart menu.
\*\* Filter, survey period and the information of the user who created the export are not included on the first page.
To keep using or print the PDF, just right-click on it.
**2. PowerPoint export**
This export creates one chart per slide.
Filter, survey period and the information of the user who created the export are also included.
1. In our PowerPoint export, no open text fields are displayed.
2. Advanced survey filters are not displayed either.
3. The company logo is also not displayed.
**3. Excel Export** (individual charts)
The Excel export can be found under the 3 dots in the respective chart menu.
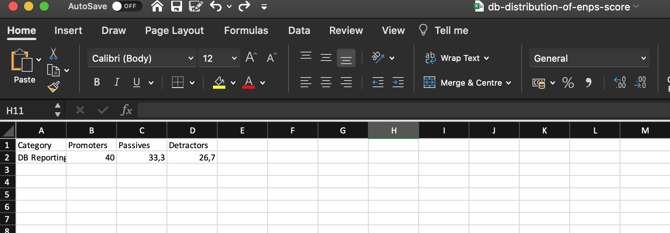
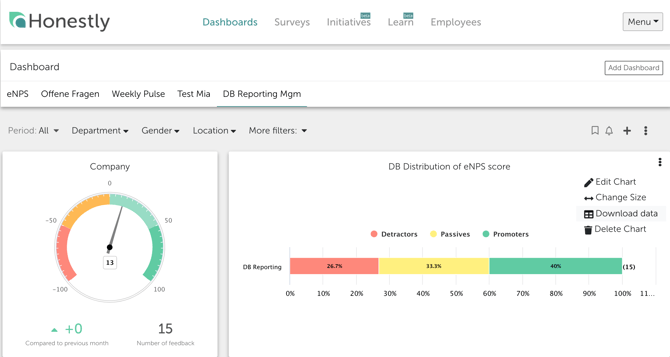 With this export, the data on which the chart is based can be exported for use elsewhere, e.g. in Excel.