> ## Documentation Index
> Fetch the complete documentation index at: https://help.honestly.com/llms.txt
> Use this file to discover all available pages before exploring further.
# How do I create a heatmap?
> A heatmap is a chart in which you can graphically compare the results of several questions, broken down by attributes (e.g. employee groups, departments, etc.).
#### What is a heatmap?
A heatmap is a chart in which you can graphically compare the results of several questions, broken down by attributes (e.g. employee groups, departments, etc.). Intuitive color coding ensures the legibility of the heatmap: #### Create your heatmap
A heatmap can be created in Honestly, [like other charts](/help/dashboard/compare-groups), in the chart editor.
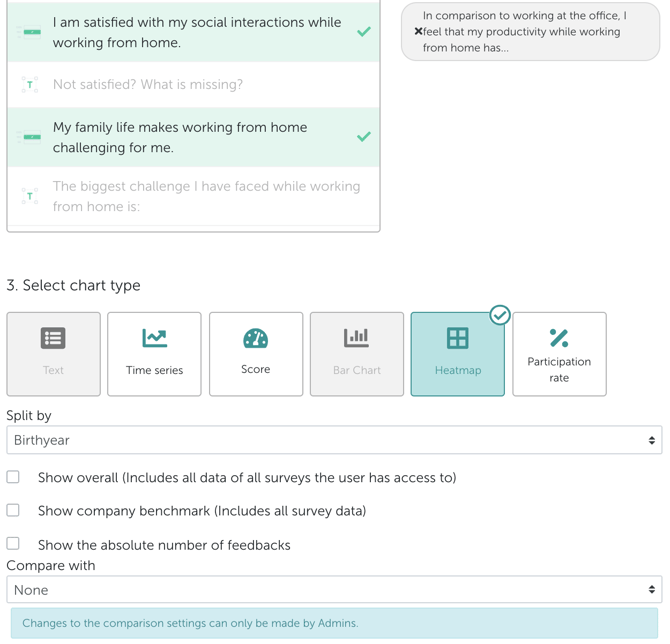
While configuring, you can select one or more questions and then select the employee group by which you want to split the results for comparison. In practice, you can split the results by department, experience, age, or any other employee group you have previously defined.
###
#### Create your heatmap
A heatmap can be created in Honestly, [like other charts](/help/dashboard/compare-groups), in the chart editor.
While configuring, you can select one or more questions and then select the employee group by which you want to split the results for comparison. In practice, you can split the results by department, experience, age, or any other employee group you have previously defined.
###  #### More functions
In addition, [internal benchmarks](/help/dashboard/compare-on-heatmaps) can be incorporated in the heat map.
#### More functions
In addition, [internal benchmarks](/help/dashboard/compare-on-heatmaps) can be incorporated in the heat map.