> ## Documentation Index
> Fetch the complete documentation index at: https://help.honestly.com/llms.txt
> Use this file to discover all available pages before exploring further.
# What is a dashboard and how do I create a new one?
> Learn how to create individual dashboards to visualize relevant survey results. Discover the steps to create and customize your dashboards.
Have a look at this video to learn all about creating dashboards:
**What is a dashboard?**
In this section, you can decide which survey results are important to you and which aren't by creating **personalised dashboards**. Either create one for each survey or combine various surveys on one dashboard.
**How do I create an automatic dashboard?**
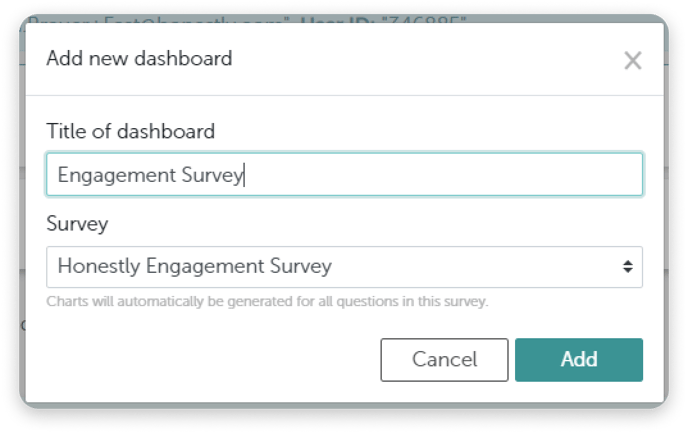
First click on "Add dashboard" (top right). A window will appear where you can give the dashboard a name and choose which survey to use as its information source.

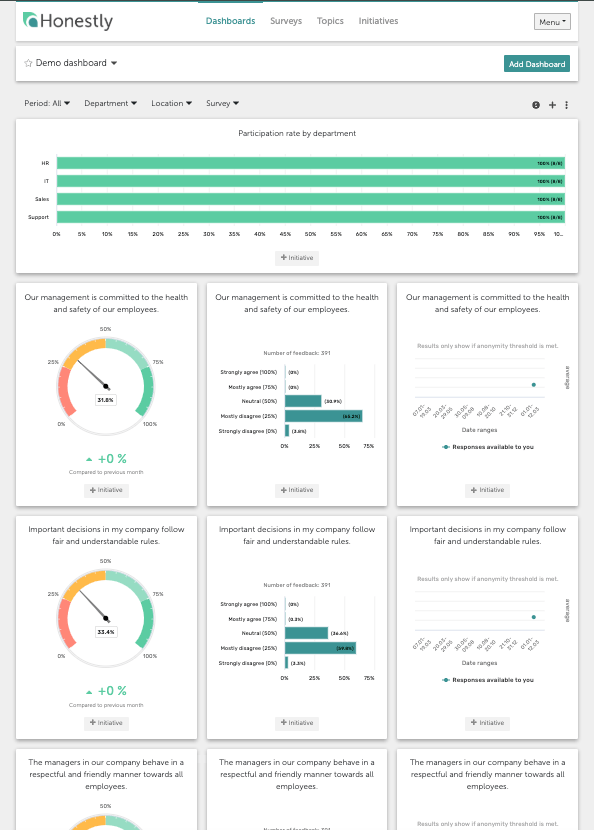
 Next, charts will automatically be created from the feedback form and will appear in exactly the same order as the questions there.
 **Tip:** You can choose to create a dashboard from scratch. You can then customise this yourself. For example, you can add different questions from different surveys here.
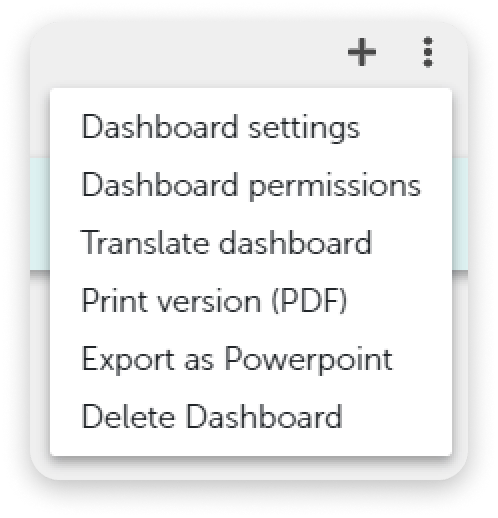
You can download the dashboard as a PDF or PowerPoint here:
**Tip:** You can choose to create a dashboard from scratch. You can then customise this yourself. For example, you can add different questions from different surveys here.
You can download the dashboard as a PDF or PowerPoint here:
 Please note that open text questions will not be included in the PowerPoint export.
If you have already created dashboards, you can find out how to edit them [here](/help/dashboard/edit-dashboard).
For tips on the following topics, click on the respective link:
* [Trend Chart](/help/dashboard/create-trend-chart)
* [Heatmap](/de/help/dashboard/create-heatmap)
Please note that open text questions will not be included in the PowerPoint export.
If you have already created dashboards, you can find out how to edit them [here](/help/dashboard/edit-dashboard).
For tips on the following topics, click on the respective link:
* [Trend Chart](/help/dashboard/create-trend-chart)
* [Heatmap](/de/help/dashboard/create-heatmap)